

Dax 40, US Dollar Talking Points
- Dax 40 roars higher before stalling at 14173
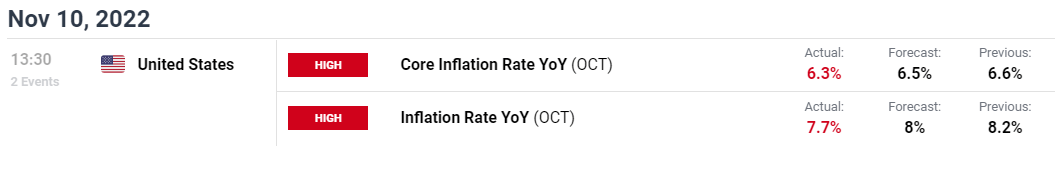
- S&P 500 explodes after a downward surprise in US CPI (October) spurred optimism
- US Dollar weakness and lower yields contribute to the bullish move in equities
Recommended by Tammy Da Costa
Get Your Free Top Trading Opportunities Forecast
US CPI Report Drives Equity Futures Higher as Dax Clears 14000
Dax futures are ripping higher after US inflation data came in softer than expected. With Core CPI falling to 6.3%, the annual inflation rate printed at 7.7%, showing promising signs of easing. The downside surprise immediately spurred a reaction in equity markets as major stock indices soared.
As expectations of a fifth 75bp rate hike dissipate, S&P 500 futures have gained over 4% while Dax follow closely behind. With the German index currently trading 3.2% higher on the day, lower US yields and a weaker Dollar continue to drive equities.
DailyFX Economic Calendar
DAX 40 Technical Analysis
After a brief retest of the 14000 psychological level earlier today, a slight pullback drove price action back towards the 13712 – 13721 that has provided resistance over the past two days. As the Dax continues to trade with conviction, the six-week rally has gained traction allowing prices to rip through two big zones of resistance at 14000 and 14052 (the 50% Fibonacci of the 2022 move).
Over the past few weeks, a rebound off the October low of 11829 has allowed Dax 40 to recover the 12% that it sacrificed during the September sell-off. Although prior trendline resistance helped cap the upward move for some time at around 13000, a hold above 13602 (the 200-day moving average) and above 14000 could allow for further gains.
Recommended by Tammy Da Costa
Futures for Beginners
As Dax reaches a daily high of 14173, the next barrier of resistance has formed at another big psych level of 14200. With the index advancing over 19% in the past six-weeks, the 88% Fibonacci of the long-term move (2003 – 2021) could provide additional resistance at 14602.
Dax 40 Daily Chart
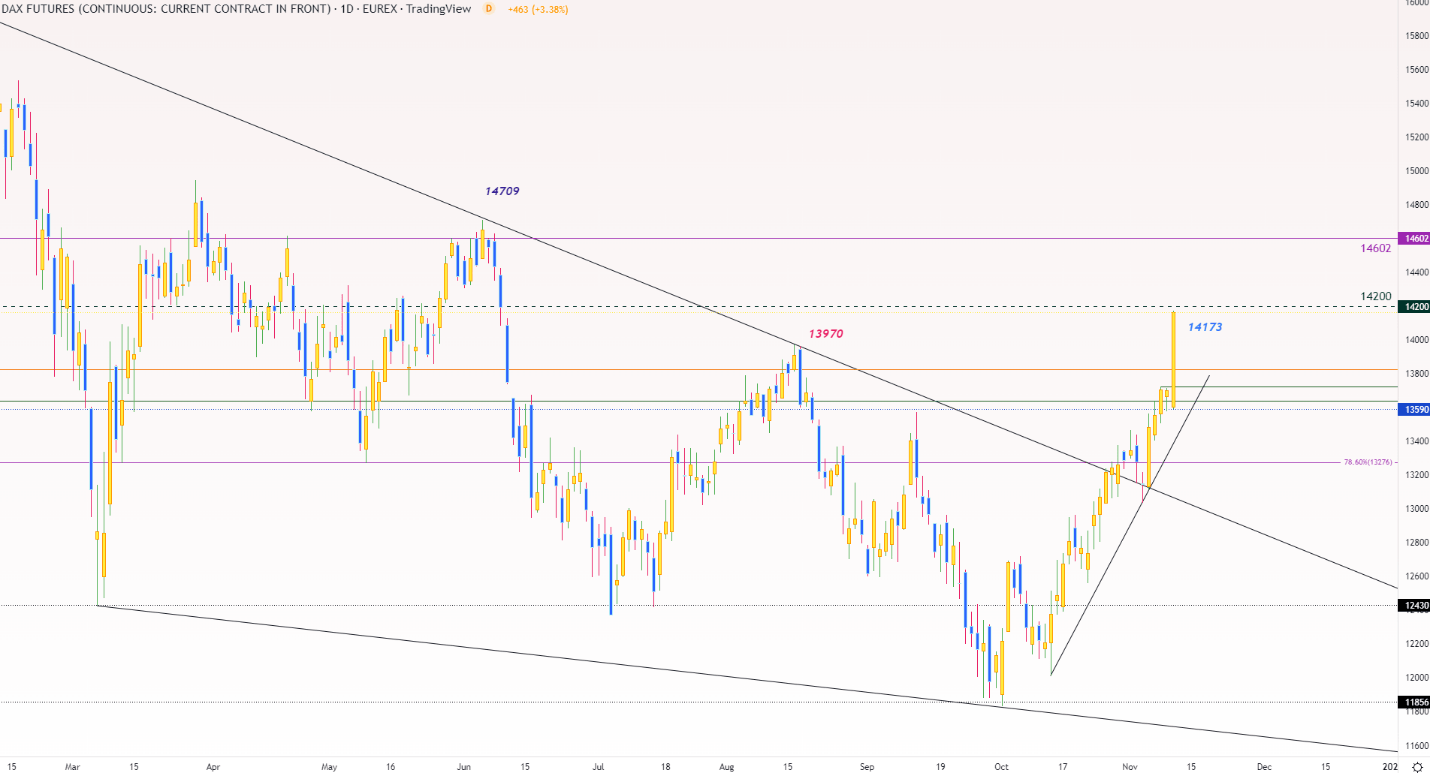
Chart prepared by Tammy Da Costa using TradingView
| Change in | Longs | Shorts | OI |
| Daily | -20% | -3% | -8% |
| Weekly | -44% | 24% | -4% |
— Written by Tammy Da Costa, Analyst for DailyFX.com
Contact and follow Tammy on Twitter: @Tams707


